RRB NTPC - GRADUATE LEVELCBT 1Graduate Level Posts
Data Interpretation
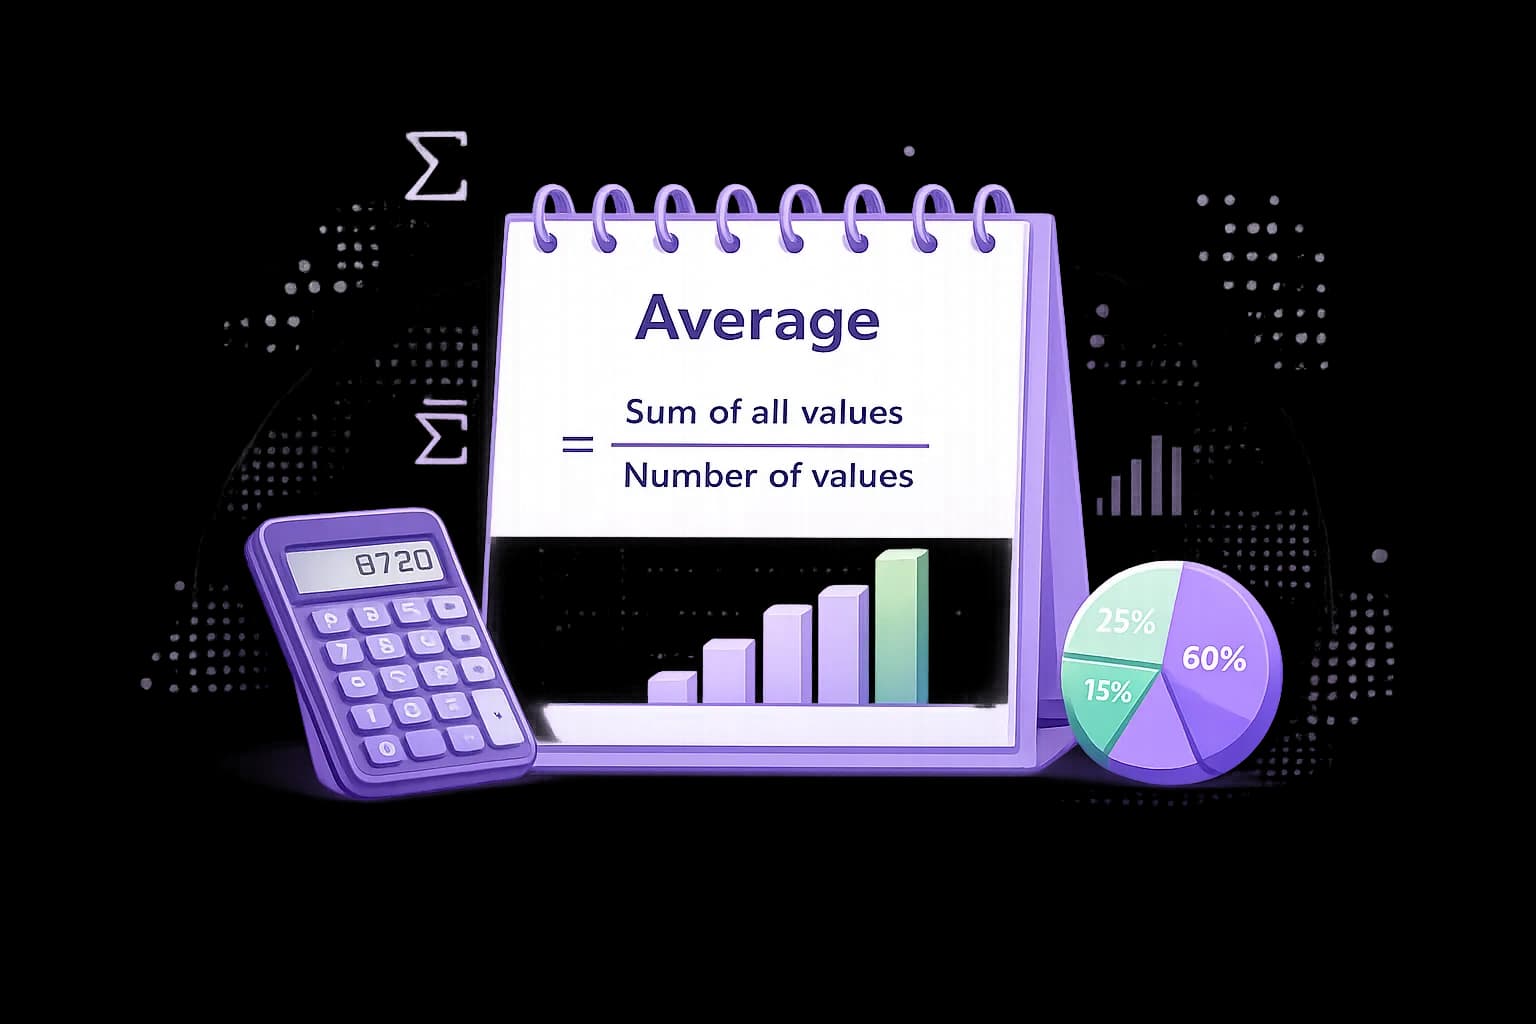
Master Bar Graphs, Pie Charts, Line Graphs, Tables and Caselets with speed calculation techniques.
6Practice Sets
10–15 minPer Test
Easy to HardDifficulty
BilingualEN + HI
Topics Covered in Data Interpretation
Data Interpretation Practice Tests
Data Interpretation Set 01
15 Questions10 MinEasyBilingual
Unattempted
Data Interpretation Set 02
15 Questions10 MinEasyBilingual
Unattempted
Data Interpretation Set 03
20 Questions12 MinMediumBilingual
Unattempted
Data Interpretation Set 04
20 Questions12 MinMediumBilingual
Unattempted
Data Interpretation Set 05
25 Questions15 MinHardBilingual
Unattempted
Data Interpretation Set 06
25 Questions15 MinHardBilingual
Unattempted
Smart Practice Path
Start with Easy, move to Medium, and challenge yourself with Hard test results.
EasyMediumHard
Why Practice Data Interpretation?
- 3-5 questions in a single set
- Combines percentage, ratio and average skills
- High scoring with fast calculation
- Essential for high rank in CBT 1
Concepts You Will Master
- Degree to percentage conversion in Pie chart (360° = 100%)
- Approximation techniques for big numbers
- Growth rate & percentage increase formula
- Ratio comparison across table columns
Preparation Tip
Practice mental percentage calculations and visual estimation to solve DI sets faster without heavy calculation.
Explore Other Maths Topics
About Data Interpretation
Data Interpretation is a vital scoring section in RRB NTPC CBT 1. A single chart/table usually yields 3-5 questions testing percentages, averages, ratios, and trend analysis.
FAQs
Multiply degrees by (100 / 360) or (5 / 18) to get percentage.
Usually 1 or 2 DI sets (3 to 5 questions) appear per shift.
Ready to Ace RRB NTPC CBT 1?
Take full mock tests & boost your preparation.